Swing High/Low & EMA Cross AlertScript Description:
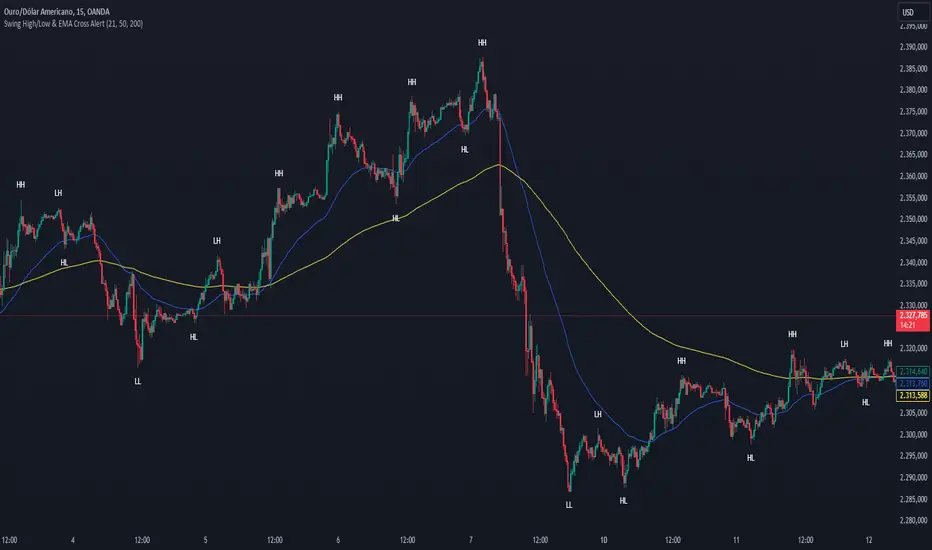
This script on TradingView combines the detection of Swing High/Low points with exponential moving average (EMA) crossovers to provide buy and sell alerts and to mark swing points on the chart.
What the Script Does:
Swing High/Low Detection:
Uses the ta.pivothigh function to detect significant high points and the ta.pivotlow function to detect significant low points.
For each detected point, the script checks if it is a new higher high (HH) or lower high (LH) for the highs, and a new lower low (LL) or higher low (HL) for the lows.
Creates visual labels to identify these points on the chart, helping traders to visualize potential reversal points.
EMA Crossover:
Calculates two EMAs: a fast EMA (fastEMA) with a default period of 50 and a slow EMA (slowEMA) with a default period of 200.
Detects bullish crossovers (when fastEMA crosses above slowEMA) and bearish crossunders (when fastEMA crosses below slowEMA).
Generates buy and sell alerts based on these crossovers.
How the Script Works:
EMA Calculation: EMAs are calculated using the closing prices and user-defined periods.
Swing High/Low Detection: Uses the high and low values from the previous length bars to determine the swing points.
Alert Generation: Alerts are triggered when crossovers between the EMAs occur.
How to Use the Script:
Add to Chart: Insert the script into TradingView and apply it to the desired chart.
Configure Parameters:
Adjust the detection period for swing points (length).
Configure the periods for the EMAs (fastLen and slowLen).
Customize the colors for the swing point labels as per your preference.
Monitor Alerts: Use the EMA crossover alerts to make buy or sell decisions. Observe the swing point labels to identify potential trend reversals.
Justification for the Combination:
EMAs: Widely used to identify trend direction. Combining a fast EMA with a slow EMA helps capture both short-term and long-term trend changes.
Swing High/Low: Identifies reversal points in price, which are crucial for determining potential entry and exit points in trades.
Combination:
Combining EMAs and Swing High/Low provides a comprehensive view of price behavior, helping traders to effectively identify trends and reversal points.
This script is useful for traders who want to combine trend analysis (via EMAs) with the identification of reversal points (Swing High/Low), providing a more complete view of price behavior on the chart.
Penunjuk Pine Script®